See all tags.
Tagged “data visualization”
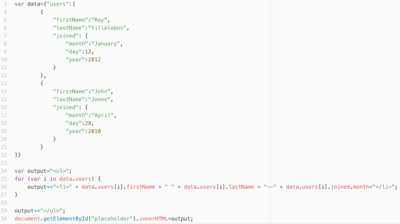
A JSON Tutorial. Getting started with JSON using JavaScript and jQuery
posts |
Javascript has grown from a way to add interactivity on your page, to a language that lets you perform tasks that once belonged to servers. JSON provides for an easy way to create and store data structures within JavaScript. It’s super popular and a great alternative to XML.

Want to get hired? Look into this technology career
posts |
The LinkedIn U.S. Emerging Jobs Report finds that job growth in the next decade outstrips growth in the previous decade creating 11.5 million jobs, estimating that 65% of children entering primary school will hold jobs that don't yet exist.
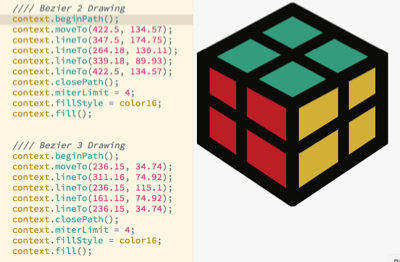
Getting started creating SVG Graphics
posts |
A lot of data visualizations use the SVG format to create graphics, so in this article, we'll use SVG to create some basic shapes and graphics. Understanding how the format works will help you when you're using SVG based libraries and frameworks.

Vector Graphic Formats Used for data visualizations
posts |
In this article, I'll talk about the different graphic formats used for visualizing data and examine some of the differences. Since most visualizations are handled in just a few different vector graphic formats, we'll see why using vectors has advantages over bitmaps because it allows us to illustrate as well as create interactions with very little overhead.
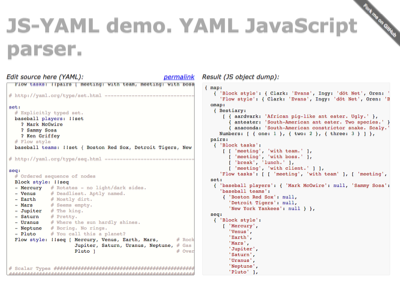
Understanding Data Formats used for Visualization Applications
posts |
In order to work with data-visualization, it's important to understand the formats commonly used to generate visual data. In this article, I'll talk about different formats for storing data plus their advantages and disadvantages and give you some resources.